| Term | Definition |
|---|---|
SWOT Analysis | 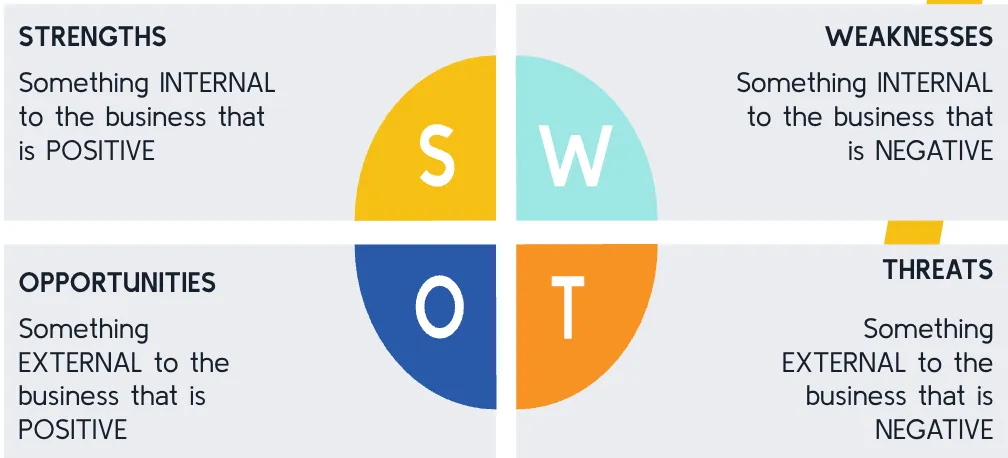 |
Ansoff Matrix | MP: increasing sales by selling existing products to the same markets (low risk).
PD: creating new products for existing markets (higher risk). High costs, and product may fail.
MD: finding new markets for existing products. (medium risk). Geographic, demographic, distribution channels.
D: selling new products into new markets. Related - similar to existing product. Unrelated - completely new product. (highest risk) 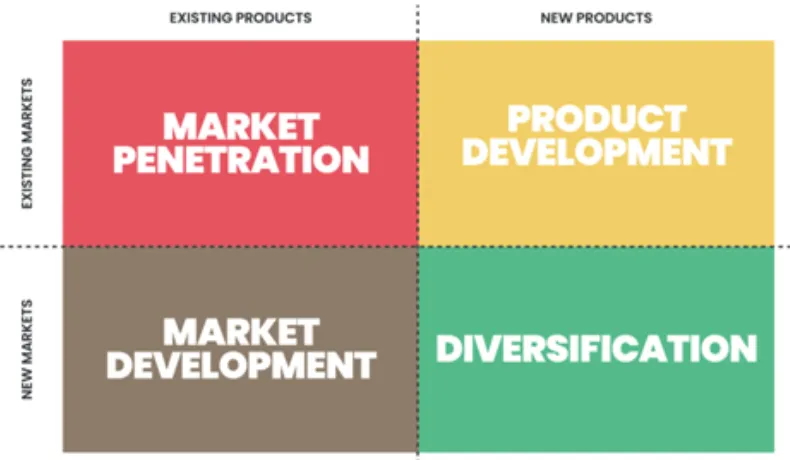 |
STEEPLE Analysis | A STEEPLE analysis takes into consideration all of the EXTERNAL factors which a business needs to be aware of when operating. 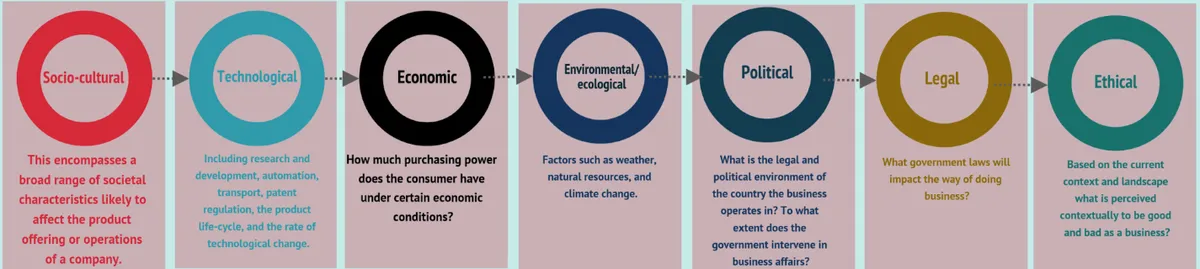 |
Circular Business Models | The purpose of a circular business model is to reduce the extraction of natural resources, reusing materials we already have and less waste at the time of disposal.
Improve supply chain: replace the use of scare resources for renewable, recyclable or bio-degradable ones.
Resource recovery: use outputs and waste produced by the company in a new way. For example, a grain company might repurpose their used grain into snack bars.
Product life extension: a business tries to extend the life of its products. For example, companies allow self-repair of products so that consumers don’t throw away their products.
Sharing models: Businesses that encourage sharing instead of purchasing on their own. Airbnb is an example of this.
Lease/rent models: customers can lease or rent products instead of owning themselves to reduce waste. 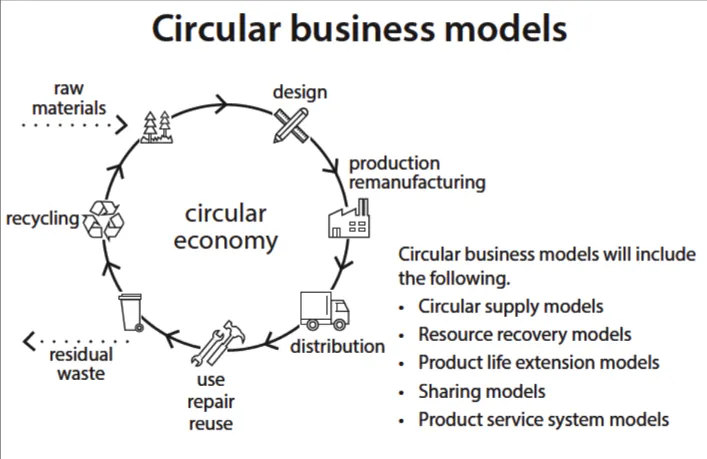 |
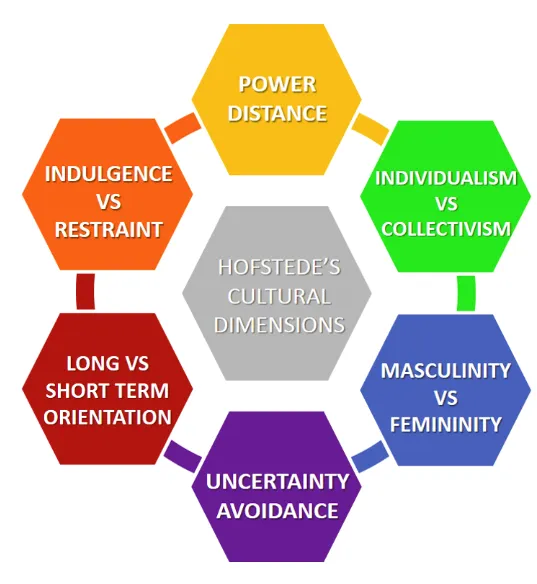
Hofstede’s Cultural Dimensions
| Hofstede’s cultural dimensions measures different aspects of national cultural.
IvC: This attribute focuses on where a culture praises individuality and personal achievements or focuses on group performance. Collectivists care about what their families and social circles think more than an individualist culture.
 |
Force Field Analysis | The Force Field Analysis allows businesses to look at the big picture by analyzing all of the forces impacting the change and weighing the pros and cons with both quantitative and qualitative factors.
|
Porters Generic Strategies | Helps businesses become competitive over similar businesses. It is used for strategic planning to differentiate their products or services.
Bottom half focused on small or niche markets
Upper half focused on large or mass markets 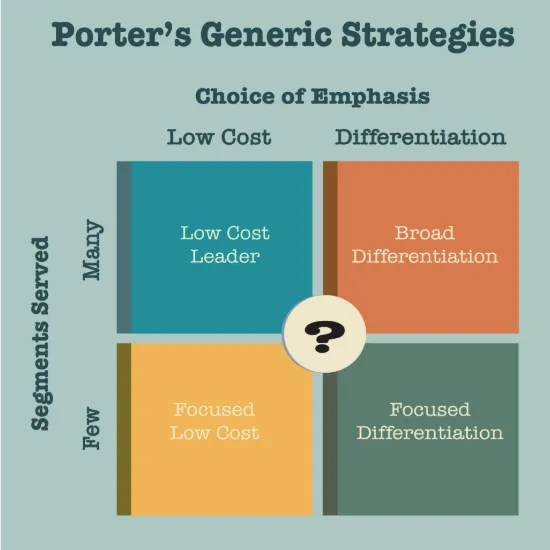 |
Simple Linear Regression/Line of Best Fit | Sometimes a business wants to see if different things they are doing have the desired affect on the business. For example, does advertising increase sales? Has training increased output?
All of the data is plotted and then businesses see if there is correlation between the two variables using a “best fit line”.
Businesses can also use this line to predict the outcome of their actions. For example, they might be able to predict how much sales will increase if they spend $X on advertising. 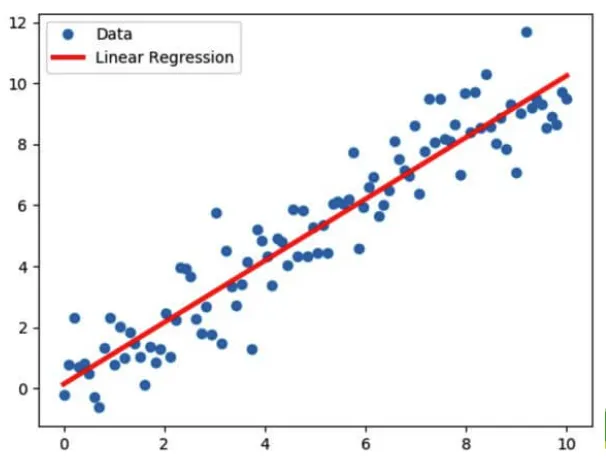 |
Boston Consulting Group Matrix | It analyzes products in terms of market share and growth of the whole market. It helps businesses make decisions about adding new products, investing in promotion, removing products and much more.
Stars: These are products with high market growth and high market share.
Cash Cows: These are products with low market growth but high market share
Question Marks: These are products with high market growth but with a low market share.
Dogs: These are products that have low market share and low market growth. 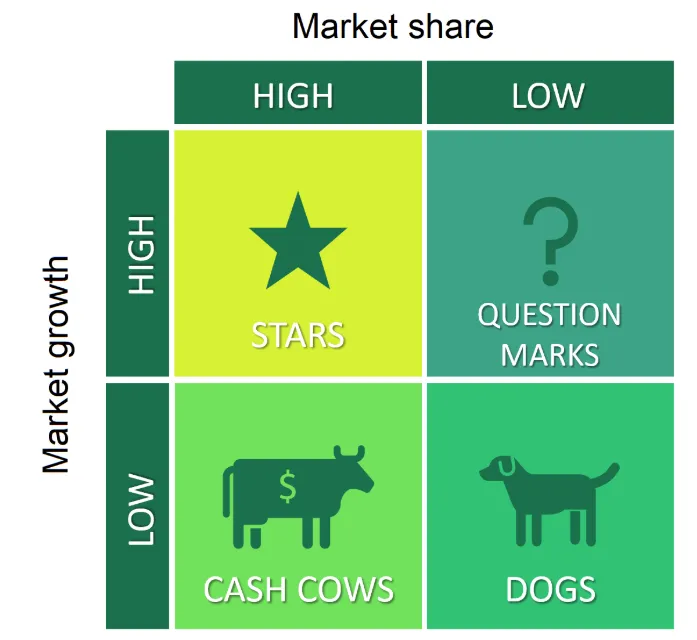 |
Contribution | Contribution per unit is the amount of money left over from the sale of a product after the variable costs have been deducted. This extra money can then be used to pay off the businesses fixed costs.  |
Contribution Continued | Businesses then multiple contribution per unit to find out total contribution to make sure they are covering all of their fixed costs.  |